
想用 PyQtChart 做绘图功能,于是在网上找到个例程,,运行了下功能能实现,,不过在任务管理器里发现这个程序占用的内存一直在增大,,应该是发生了内存泄漏
显示数据是由 series_to_polyline()构建的,里面用到了 numpy,,哪位大神知道这种情况怎么解决?
运行效果:
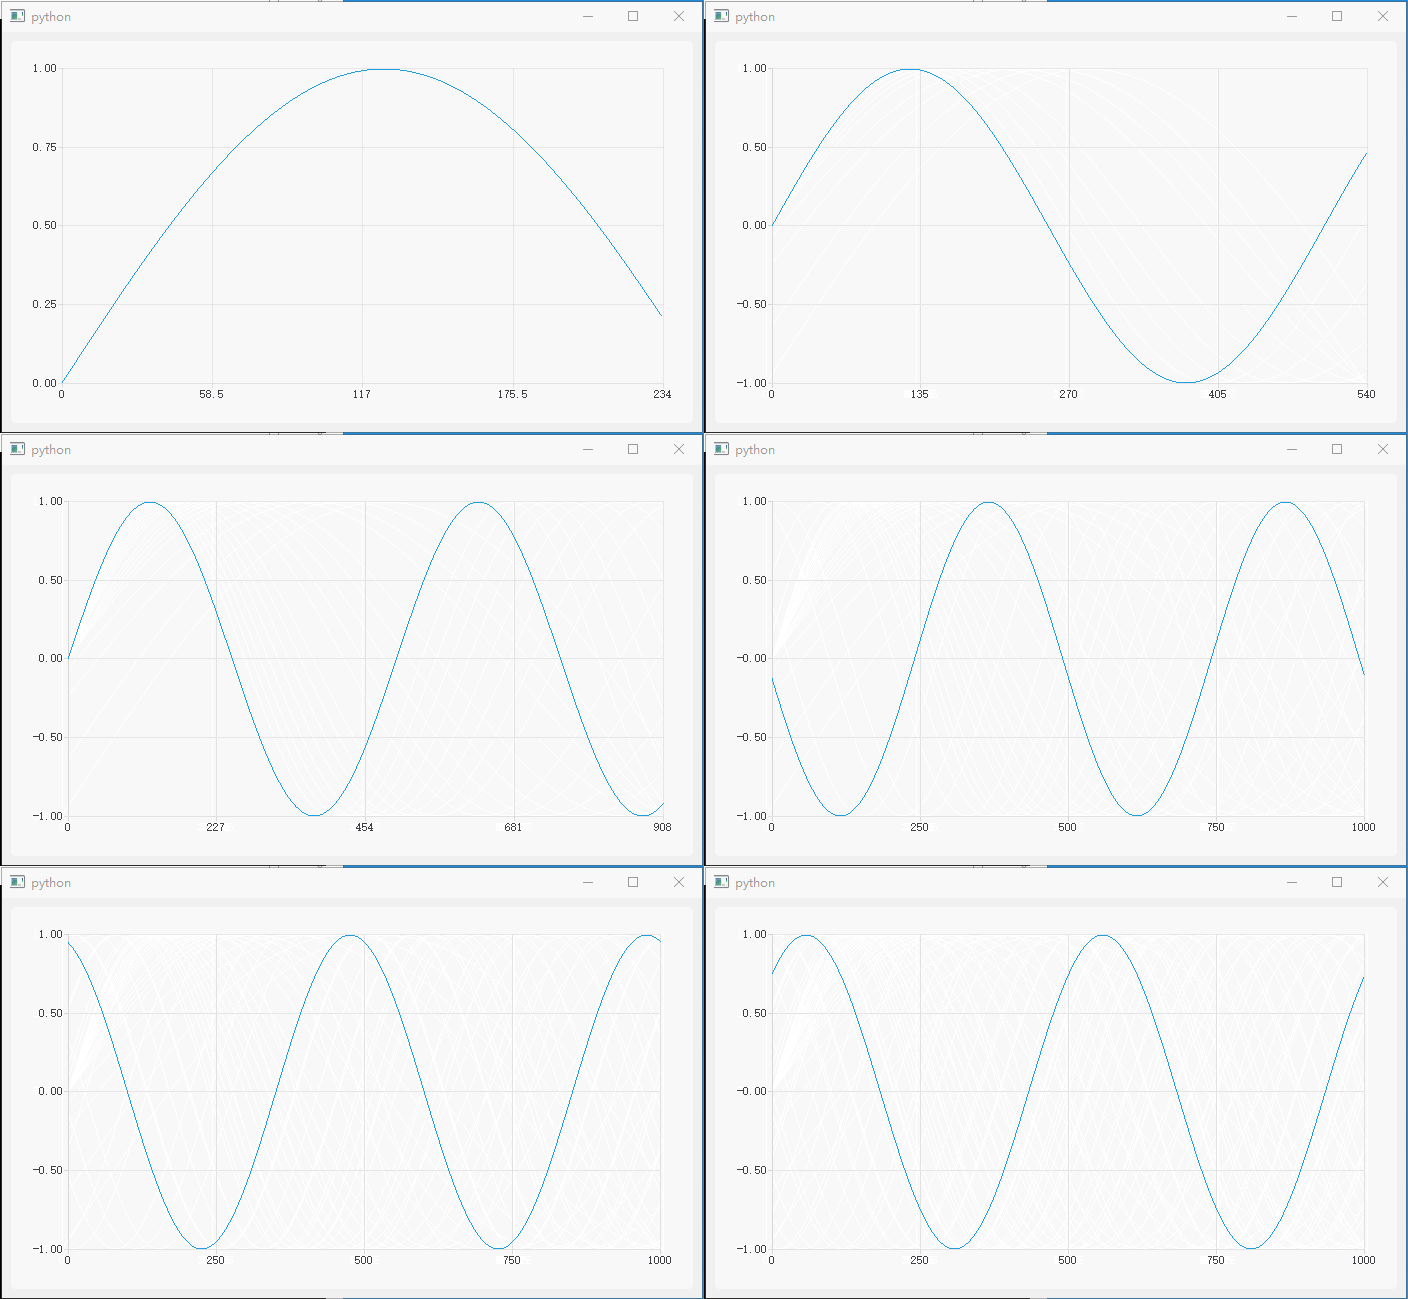
代码:
import os
import sys
import math
import array

from PyQt5.QtCore import Qt, QTimer, QPointF
from PyQt5.QtGui  import QPolygonF
from PyQt5.QtWidgets import QApplication, QMainWindow

from PyQt5.QtChart import QChart, QChartView, QLineSeries

import numpy as np

class DemoWindow(QMainWindow):
    def __init__(self, parent=None):
        super(DemoWindow, self).__init__(parent=parent)

        self.plotChart = QChart()
        self.plotChart.legend().hide()

        self.plotView = QChartView(self.plotChart)
        self.setCentralWidget(self.plotView)

        self.plotCurve = QLineSeries()
        self.plotCurve.setUseOpenGL(True)
        self.plotCurve.pen().setColor(Qt.red)
        self.plotChart.addSeries(self.plotCurve)

        self.plotChart.createDefaultAxes()
        self.plotChart.axisX().setLabelFormat('%g')

        self.RecvData = array.array('f')    # 存储接收到的传感器数据
        self.RecvIndx = 0

        self.tmrData = QTimer()             # 模拟传感器传送过来数据
        self.tmrData.setInterval(3)
        self.tmrData.timeout.connect(self.on_tmrData_timeout)
        self.tmrData.start()

        self.tmrPlot = QTimer()
        self.tmrPlot.setInterval(100)
        self.tmrPlot.timeout.connect(self.on_tmrPlot_timeout)
        self.tmrPlot.start()

    def on_tmrData_timeout(self):
        val = math.sin(2*3.14 / 500 * self.RecvIndx)
        self.RecvData.append(val)

        self.RecvIndx += 1

    def series_to_polyline(self, xdata, ydata):
        """Convert series data to QPolygon(F) polyline

        This code is derived from PythonQwt's function named
        `qwt.plot_curve.series_to_polyline`"""
        size = len(xdata)
        polyline = QPolygonF(size)
        pointer = polyline.data()
        dtype, tinfo = np.float, np.finfo  # integers: = np.int, np.iinfo
        pointer.setsize(2*polyline.size()*tinfo(dtype).dtype.itemsize)
        memory = np.frombuffer(pointer, dtype)
        memory[:(size-1)*2+1:2] = xdata
        memory[1:(size-1)*2+2:2] = ydata

        return polyline

    def on_tmrPlot_timeout(self):
        self.RecvData = self.RecvData[-1000:]

        plotData = self.series_to_polyline(range(len(self.RecvData)), self.RecvData)

        self.plotCurve.replace(plotData)
        self.plotChart.axisX().setMax(len(plotData))
        self.plotChart.axisY().setRange(min(self.RecvData), max(self.RecvData))


if __name__ == '__main__':
    app = QApplication(sys.argv)
    window = DemoWindow()
    window.show()
    window.resize(700, 400)
    sys.exit(app.exec_())


 1
1
 Select Language